#Load in data

install.packages("tidytuesdayR")
## Warning in readRDS(dest): lzma decoder corrupt data
##
##   There is a binary version available but the source version is later:
##              binary source needs_compilation
## tidytuesdayR  1.0.2  1.1.2             FALSE
## installing the source package 'tidytuesdayR'
install.packages("readr")
##
##   There is a binary version available but the source version is later:
##       binary source needs_compilation
## readr  2.1.4  2.1.5              TRUE
## installing the source package 'readr'
install.packages("bit")
##
##   There is a binary version available but the source version is later:
##     binary source needs_compilation
## bit  4.0.5  4.6.0              TRUE
## installing the source package 'bit'
install.packages("vcd")
##
##   There is a binary version available but the source version is later:
##     binary source needs_compilation
## vcd 1.4-11 1.4-13             FALSE
## installing the source package 'vcd'
install.packages("grid")
## Warning: package 'grid' is a base package, and should not be updated
install.packages("ggmosaic")
##
## The downloaded binary packages are in
##  /var/folders/sn/blx0r77j44d3jcgszq6dw0d80000gn/T//Rtmp5s56oQ/downloaded_packages
install.packages("waffle")
##
##   There is a binary version available but the source version is later:
##        binary source needs_compilation
## waffle  0.7.0  1.0.2             FALSE
## installing the source package 'waffle'
install.packages("ggridges")
##
##   There is a binary version available but the source version is later:
##          binary source needs_compilation
## ggridges  0.5.4  0.5.6             FALSE
## installing the source package 'ggridges'
install.packages("ggbeeswarm")
##
## The downloaded binary packages are in
##  /var/folders/sn/blx0r77j44d3jcgszq6dw0d80000gn/T//Rtmp5s56oQ/downloaded_packages
library(ggplot2)
library(vcd)
## Loading required package: grid
library(grid)
library(ggmosaic)
##
## Attaching package: 'ggmosaic'
## The following objects are masked from 'package:vcd':
##
##     mosaic, spine
library(tidyr)
library(dplyr)
##
## Attaching package: 'dplyr'
## The following objects are masked from 'package:stats':
##
##     filter, lag
## The following objects are masked from 'package:base':
##
##     intersect, setdiff, setequal, union
palmtrees <- readr::read_csv('https://raw.githubusercontent.com/rfordatascience/tidytuesday/main/data/2025/2025-03-18/palmtrees.csv')
## Rows: 2557 Columns: 29
## ── Column specification ─────────────────────────────────────────────────────
## Delimiter: ","
## chr (17): spec_name, acc_genus, acc_species, palm_tribe, palm_subfamily, cli...
## dbl (12): max_stem_height_m, max_stem_dia_cm, max_leaf_number, max__blade__l...
##
## ℹ Use `spec()` to retrieve the full column specification for this data.
## ℹ Specify the column types or set `show_col_types = FALSE` to quiet this message.
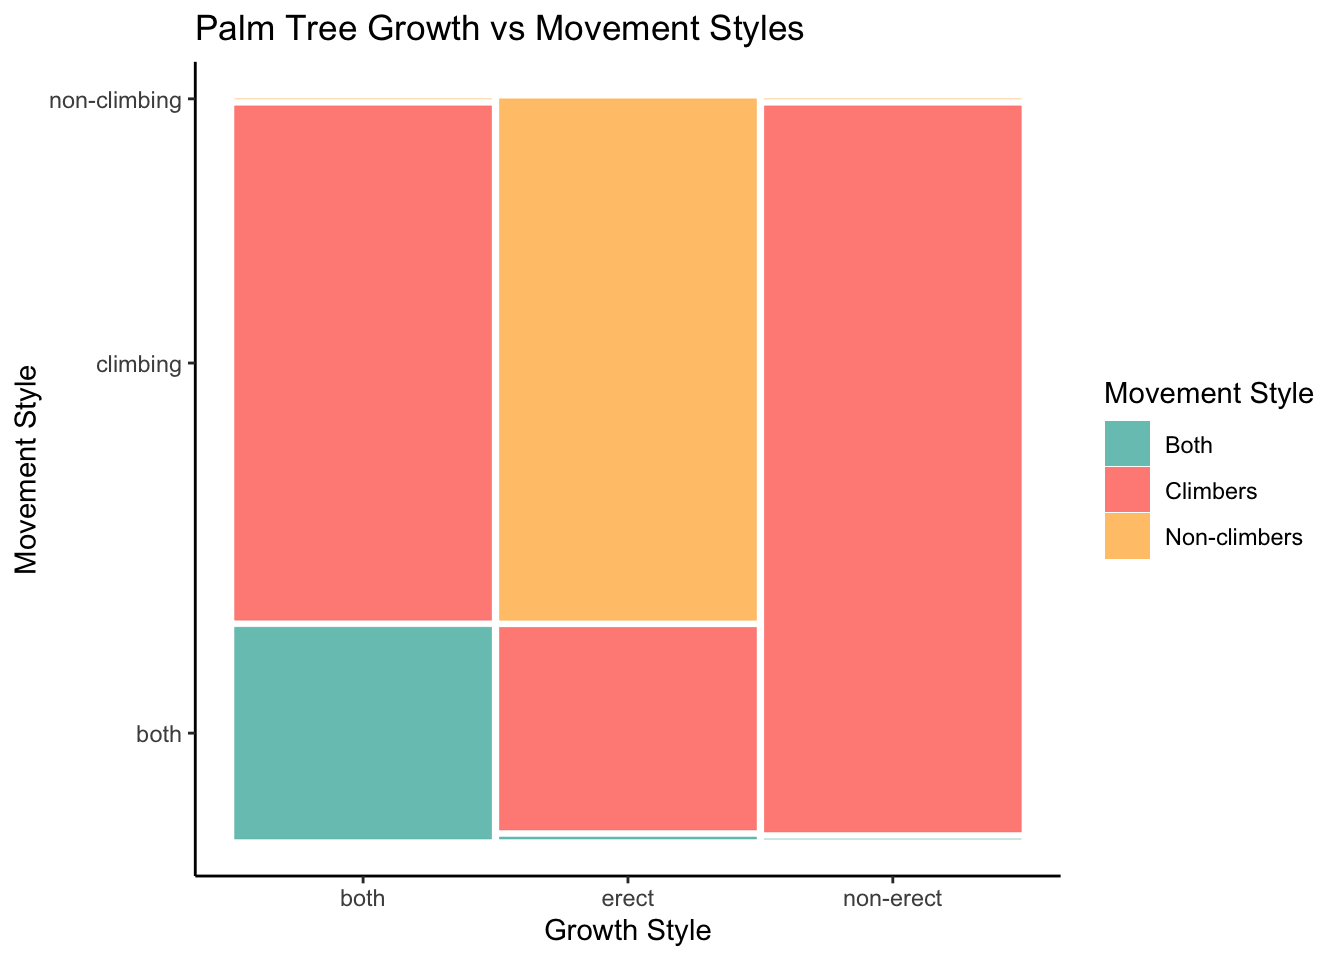
# Mosaic plot
ggplot(data = palmtrees) +
  geom_mosaic(aes(x = product(climbing), fill = climbing, conds = product(erect))) +
  labs(
    title = 'Palm Tree Growth vs Movement Styles',
    x = "Growth Style",
    y = "Movement Style"
  ) +
  scale_fill_manual(
    name = 'Movement Style',
    values = c('both' = '#4db6ac', 'climbing' = '#ff6f61', 'non-climbing' = '#ffb74d'),
    labels = c('both' = 'Both', 'climbing' = 'Climbers', 'non-climbing' = 'Non-climbers')
  ) +
  theme_classic()
## Warning: The `scale_name` argument of `continuous_scale()` is deprecated as of
## ggplot2 3.5.0.
## This warning is displayed once every 8 hours.
## Call `lifecycle::last_lifecycle_warnings()` to see where this warning was
## generated.
## Warning: The `trans` argument of `continuous_scale()` is deprecated as of ggplot2
## 3.5.0.
## ℹ Please use the `transform` argument instead.
## This warning is displayed once every 8 hours.
## Call `lifecycle::last_lifecycle_warnings()` to see where this warning was
## generated.
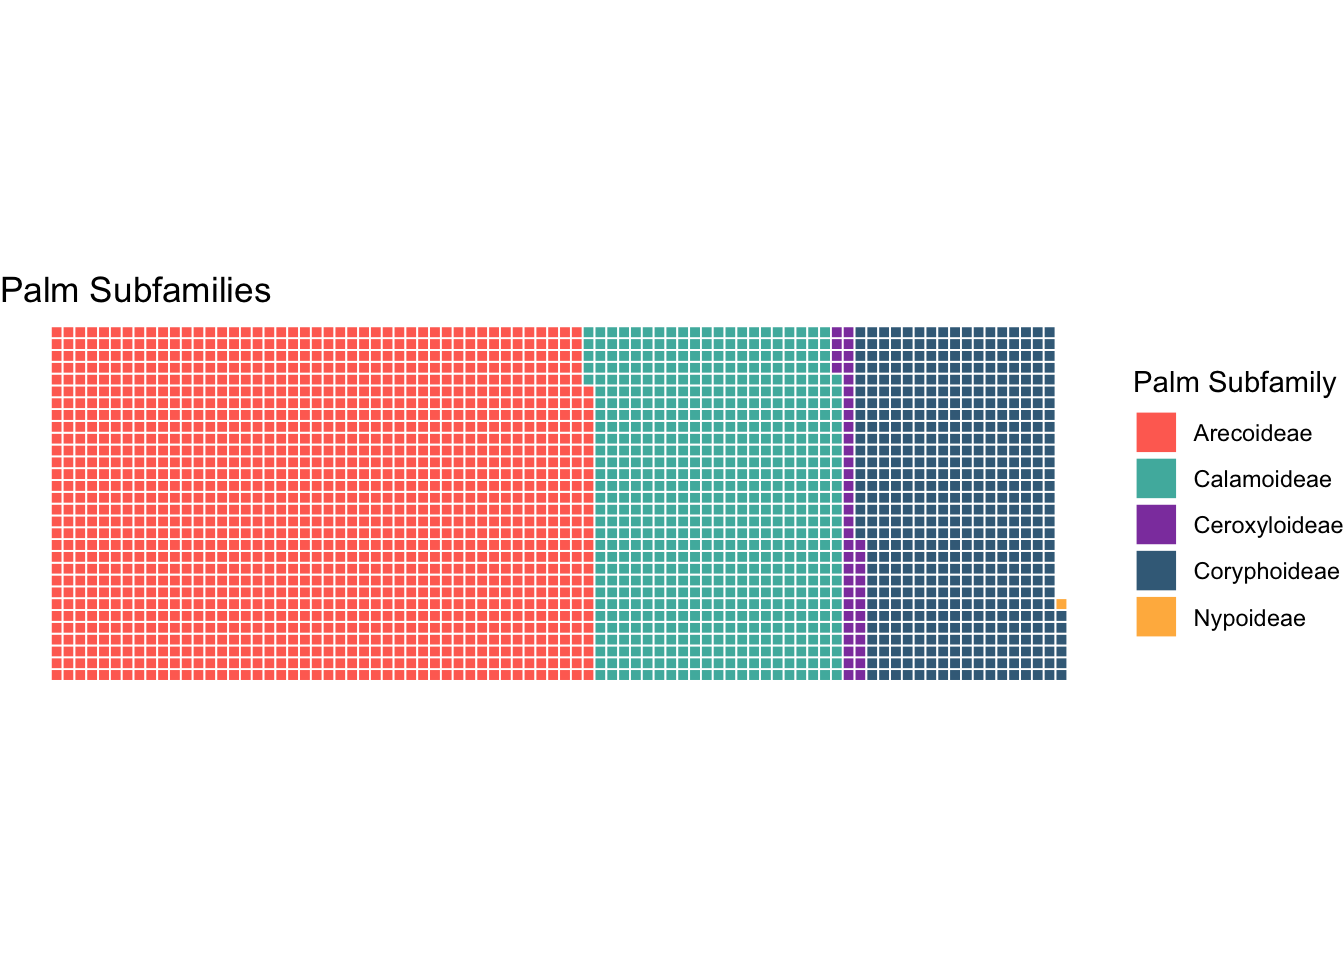
#Waffle Plot

freq_table <- as.data.frame(table(subfamily=palmtrees$palm_subfamily))

custom_colors <- c("Arecoideae" = "#FF6F61",
                   "Calamoideae" = "#4DB6AC",
                   "Ceroxyloideae" = "#8E44AD",
                   "Coryphoideae" = "#3E6C88",
                   "Nypoideae" = "#FFB74D")

# Create the waffle plot
ggplot(data = freq_table) +
  aes(fill = subfamily, values = Freq) +
  waffle::geom_waffle(n_rows = 30, size = 0.33, colour = "white") +
  coord_equal() +
  scale_fill_manual(values = custom_colors) +  # Apply custom colors
  theme_void() +
  labs(title = "Palm Subfamilies") +
  guides(fill = guide_legend(title = "Palm Subfamily"))
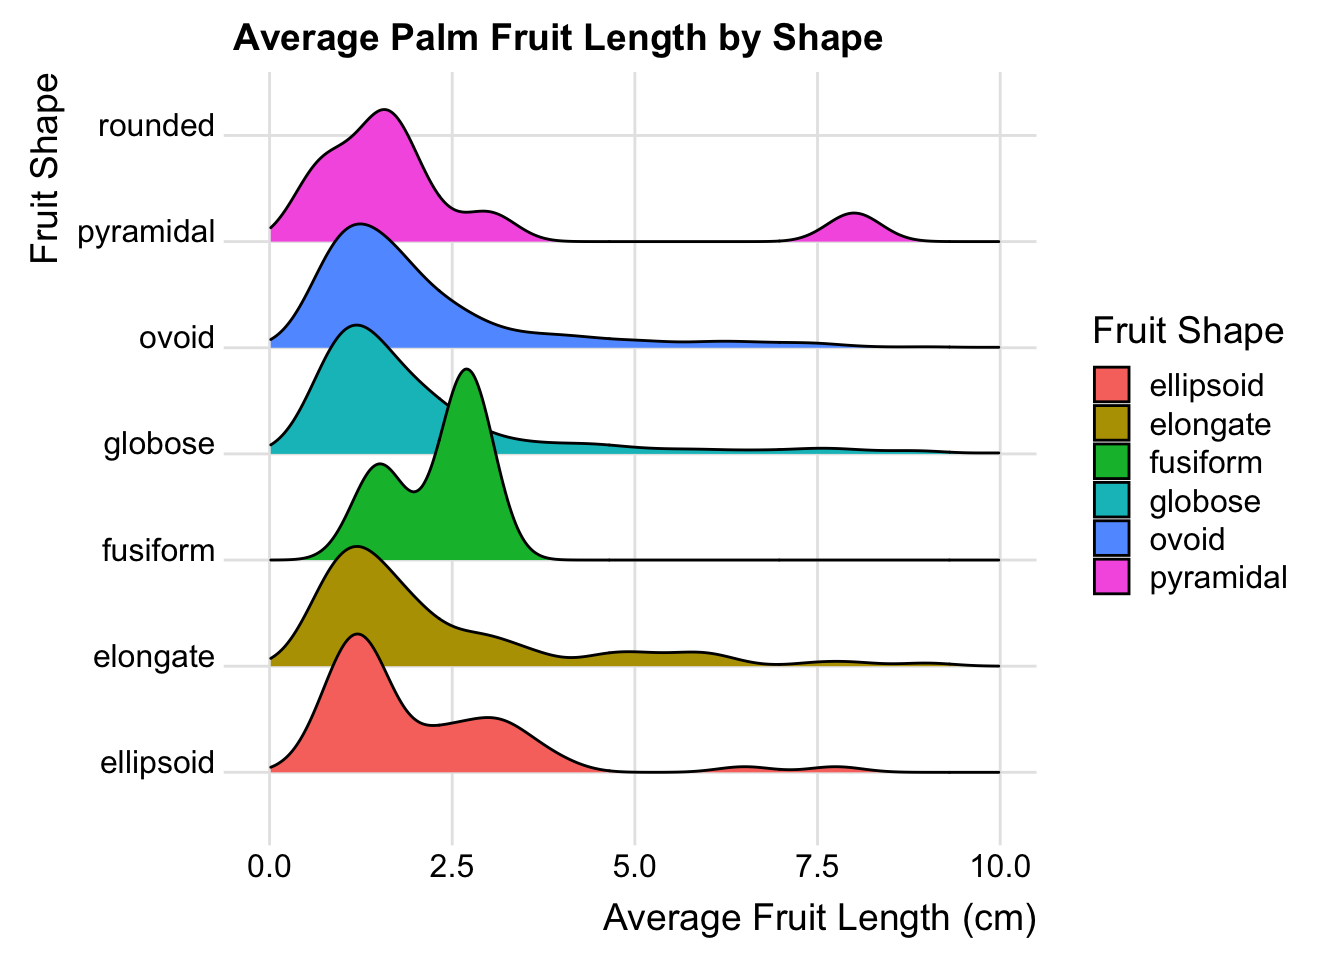
#Ridgeline Plot

palmtrees_fil <- palmtrees %>% dplyr::filter(!is.na(palmtrees$fruit_shape))

ggplot(data = palmtrees_fil) +
  aes(x=average_fruit_length_cm,y=fruit_shape,fill=fruit_shape) +
  ggridges::geom_density_ridges() +
  labs(
    title = 'Average Palm Fruit Length by Shape',
    x = "Average Fruit Length (cm)",
    y = "Fruit Shape"
  ) +
    guides(fill = guide_legend(title = "Fruit Shape")) +
  ggridges::theme_ridges() +
  scale_x_continuous(limits = c(0, 10))
## Picking joint bandwidth of 0.366
## Warning: Removed 342 rows containing non-finite outside the scale range
## (`stat_density_ridges()`).
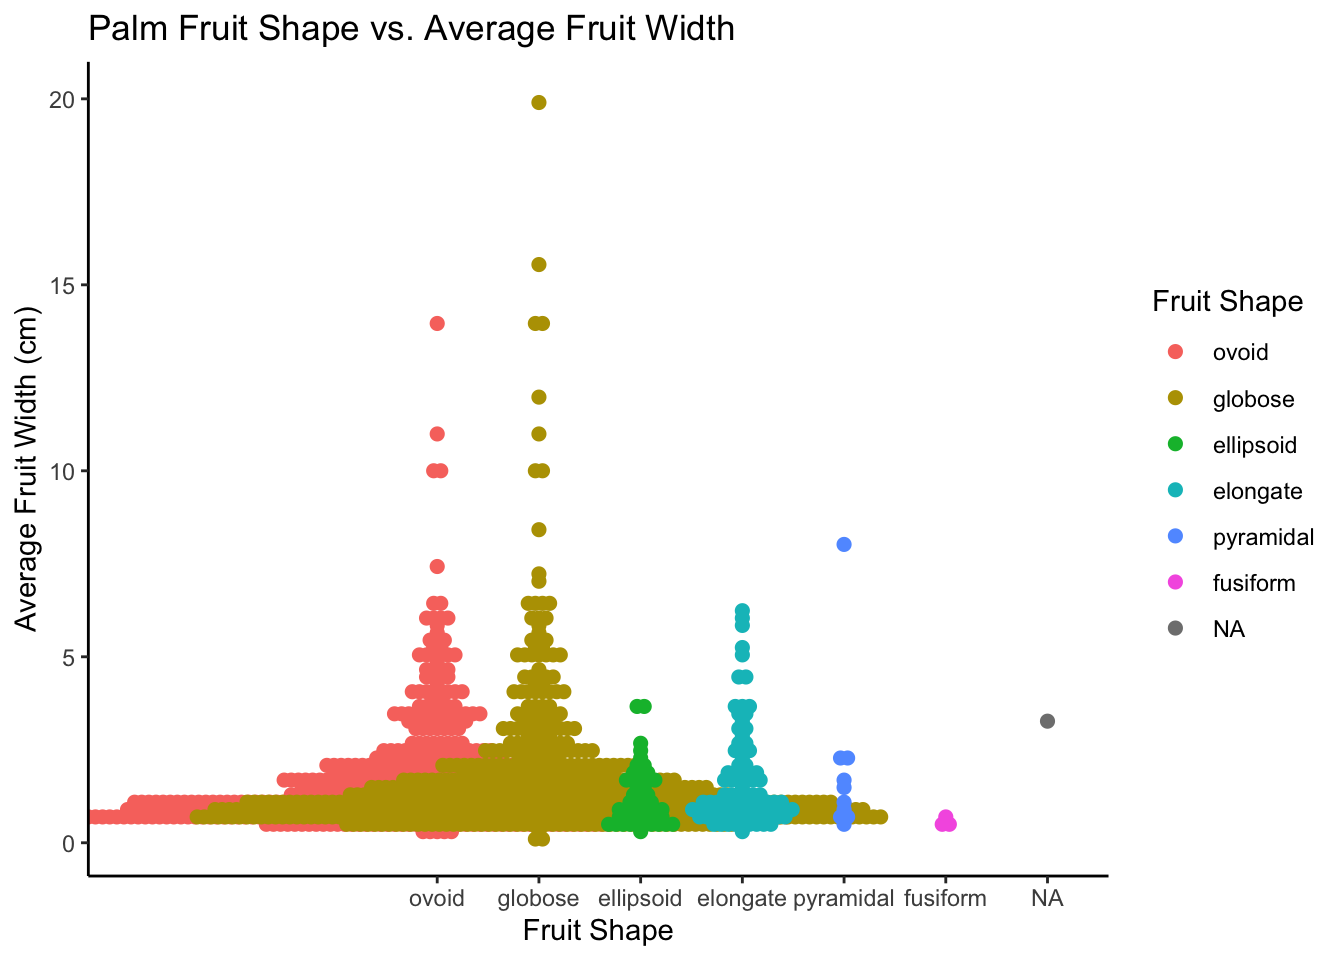
#Beeswarm Plot

palmtrees_filtered <- palmtrees_fil %>%
  filter(!is.na(palmtrees_fil$fruit_shape))

palmtrees_filtered$fruit_shape <- factor(palmtrees_filtered$fruit_shape,
                                   levels = c("ovoid", "globose", "ellipsoid", "elongate","pyramidal", "fusiform", "rouded"))

ggplot(data = palmtrees_filtered) +
  aes(x = fruit_shape, y = average_fruit_width_cm, color = fruit_shape) +
  ggbeeswarm::geom_beeswarm(method = "center", size = 2) +
  labs(title = "Palm Fruit Shape vs. Average Fruit Width",
    x = "Fruit Shape",
    y = "Average Fruit Width (cm)") +
  guides(color = guide_legend(title = "Fruit Shape")) +
  theme_classic()
## Warning: In `position_beeswarm`, method `center` discretizes the data axis (a.k.a the
## continuous or non-grouped axis).
## This may result in changes to the position of the points along that axis,
## proportional to the value of `cex`.
## This warning is displayed once per session.
## Warning: Removed 371 rows containing missing values or values outside the scale range
## (`geom_point()`).